Finding python memory leaks with objgraph
I have had a rogue memory leak in one of my programs for a while, but I have now been able to track it down.
It hasn't been an issue until recently when I have been trying to solve a large number of problems. I did some googling and came up with objgraph a module that lets you graphically explore the objects that remain in python's memory.
As python is a garbage collected language memory leaks tend to be caused by one of these reasons
- Accidentally adding a reference to objects to something in the global scope so they are never garbage collected
- Circular references that contain an object with a custom __del__() method
- Memory leakage in a C extension module
- some other reasons that I have not encounted :-)
To diagnose the first two object graph provides a nice interface.
To install objgraph for interactive use in Ubuntu
$ sudo apt-get python-pygraphviz
$ sudo pip install xdot
$ sudo pip install objgraph
Here is my example using the pulp library.
My application repeatedly created a pulp model and solved it using Gurobi.
import objgraph
for i in range(10):
    objgraph.show_growth(limit=3)
    create_and_solve_model())
objgraph.show_growth()
import pdb;pdb.set_trace()
If all was working well the model would have gone out of scope and disappeared by the second call of objgraph.show_growth()
however I get the following
dict                3951      +301
list                2091      +170
LpVariable          1200      +120
Constr               960       +96
LpConstraint         960       +96
Var                  920       +92
tuple                968       +24
defaultdict          111       +11
> /home/stuart/example.py(52)<module>()
-> import pdb;pdb.set_trace()
(Pdb)
As you can see somthing has gone wrong and objects are staying in memory
If I then pick a class ('LpVariable) and trace back graphically the references to it like so
(Pdb) import random
(Pdb) import inspect
(Pdb) objgraph.show_chain(
          objgraph.find_backref_chain(
          random.choice(objgraph.by_type('LpVariable')),
          inspect.ismodule))
I get the following graph displayed in a window with xdot.
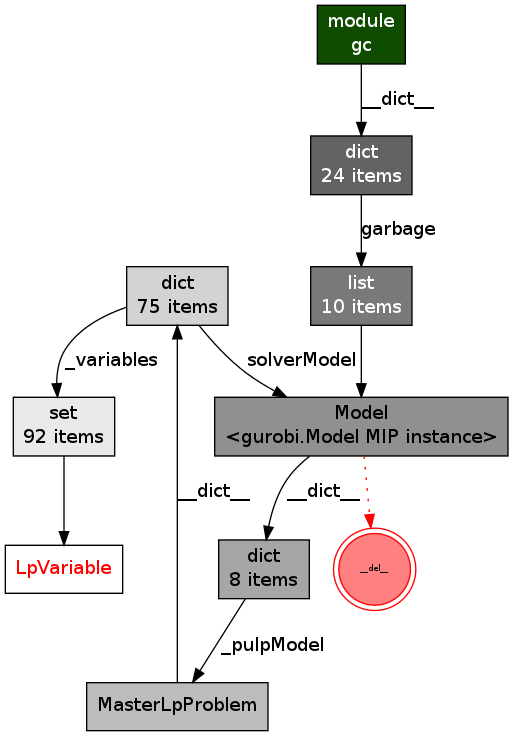 objgraph image showing a circular reference
From this graph it is quite clear that there is a circular reference involving the Gurobi model and my MasterLpProblem object. As the Gurobi model has a defined __del__ method the garbage collector does not delete it but rather stores it in the gc.garbage list.
After looking in my code I see that when I create a gurobi model I add a reference to the pulp.LpProblem that created it.
def buildSolverModel(self, lp):
    """
    Takes the pulp lp model and translates it into a gurobi
    model
    """
    log.debug("create the gurobi model")
    self.solverModel = lp.solverModel = gurobipy.Model(lp.name)
    ...
    lp.solverModel._pulpModel = lp
    ...
This I thought was a good idea at the time but have never used it. So I deleted the 'lp.solverModel._pulpModel = lp' line, and my memory leak disappeared.
When I rerun the previous code I now get.
> /home/stuart/example.py(52)<module>()
-> import pdb;pdb.set_trace()
(Pdb)
Indicating that there is no growth in memory usage.
Hurray
 programming